Image map refers to a picture on a web page that provides different
links to various other web pages. The main image contains hot areas, which
are associated with a hyperlink that takes you to another page. To define
hot areas on an image, you can use image coordinates. There can be three
types of shape coordinates that you can use in your image. These shape
types are:
·
Rec: Using this shape, you can define a rectangle coordinate on
the figure. For this you need two coordinates, top right and bottom left.
For example:
Shape “rect” coords =”0,0,10,10”
·
Circ: Using this shape, you can define a circle coordinate on the
figure. For this you need the center coordinate and the radius size. For
example:
Shape ="circ" coords ="30,100,10"
·
Poly: Using this shape, you can define a polygon on the figure.
For this you need all the five coordinates of the polygon. For example:
Shape ="poly" coords ="40,50,55,60,70,80,85,90,145,126"
To use JavaScript in image maps, you need to add events
to the <area > tag inside the image map. The events such as onClick,
onDblClick, onMouseDown, onMouseUp, onMouseOver, onMouseMove, onMouseOut,
onKeyPress, onKeyDown, onKeyUp, onFocus, and onBlur can be used in <area>
tag.
To enable image mapping, you need to use the usemap
attribute in the <image >tag to define that the image used has clickable
areas. Further, you need to use <map> and <area> tags, which
immediately follows <image> tag. For <area>tags, the <map>
tag works as a container to define the hot areas or clickable spots. The
<area> tag defines the coordinates for a shape to create a clickable
boundary for the hot spot.
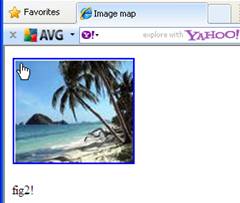
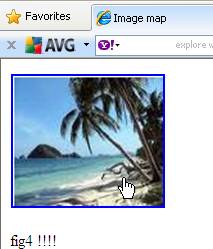
The code given below uses four images. When the onMouseOver
event occurs, it calls the function writeText() and displays the fig name.
When you click on the hotspot, it takes you to a different image.
|
<html>
<script type="text/javascript">
function writeText(txt)
{ document.getElementById("desc").innerHTML=txt
}
</script>
<body>
<img src ="fig1.jpg" width ="150" height
="130" alt="fig1"
usemap="#fig1"/>
<map id ="fig1" name="fig1">
<area shape
="rect" coords ="0,0,10,10"onMouseOver="writeText('fig1!')"
href ="fig2.jpg"
target ="_default" alt="fig2" />
<area shape
="circ" coords ="120,20,10"onMouseOver="writeText('fig3!’)"
href =fig3.jpg
target ="_blank" alt="fig3" />
<area shape
="poly" coords ="40,50,55,60,70,80,85,90,145,126"
onMouseOver="writeText('fig3
!!!!')"
href =fig4.jpg
target ="_blank" alt="fig4" />
</map>
<p id="desc"></p>
</body>
</html> |
The image below shows the clickable image fig1 that contains
hotspots. The first hotspot appears at the top left corner in the shape
of a rectangle. On mouse over the text fig2 appears and on clicking it
another image fig2 appears.
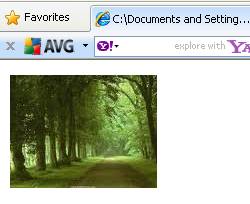
The result of the code
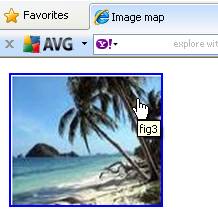
The second hotspot appears at the right corner in the
shape of a circle. On mouse over the text fig3 appears and on clicking
it, another image fig3 appears.
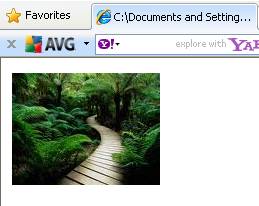
The third hotspot appears at the bottom right corner in
the shape of a polygon. On mouse over the text fig4 appears and on clicking
it, another image fig4 appears.
|